How TPG determines the best US airlines
Every year, the TPG aviation team spends months crunching the numbers to come to a data-backed ranking of the top U.S. airlines.
Our report, which is widely cited across the airline and travel sectors, sources key industry statistics from the U.S. Department of Transportation, Bureau of Transportation Statistics, and publicly-available information from the airlines themselves.
The goal: to arm travelers with an objective snapshot of each carrier's strengths and weaknesses.
The methodology
TPG's Best Airlines Report is based on four weighted core categories.
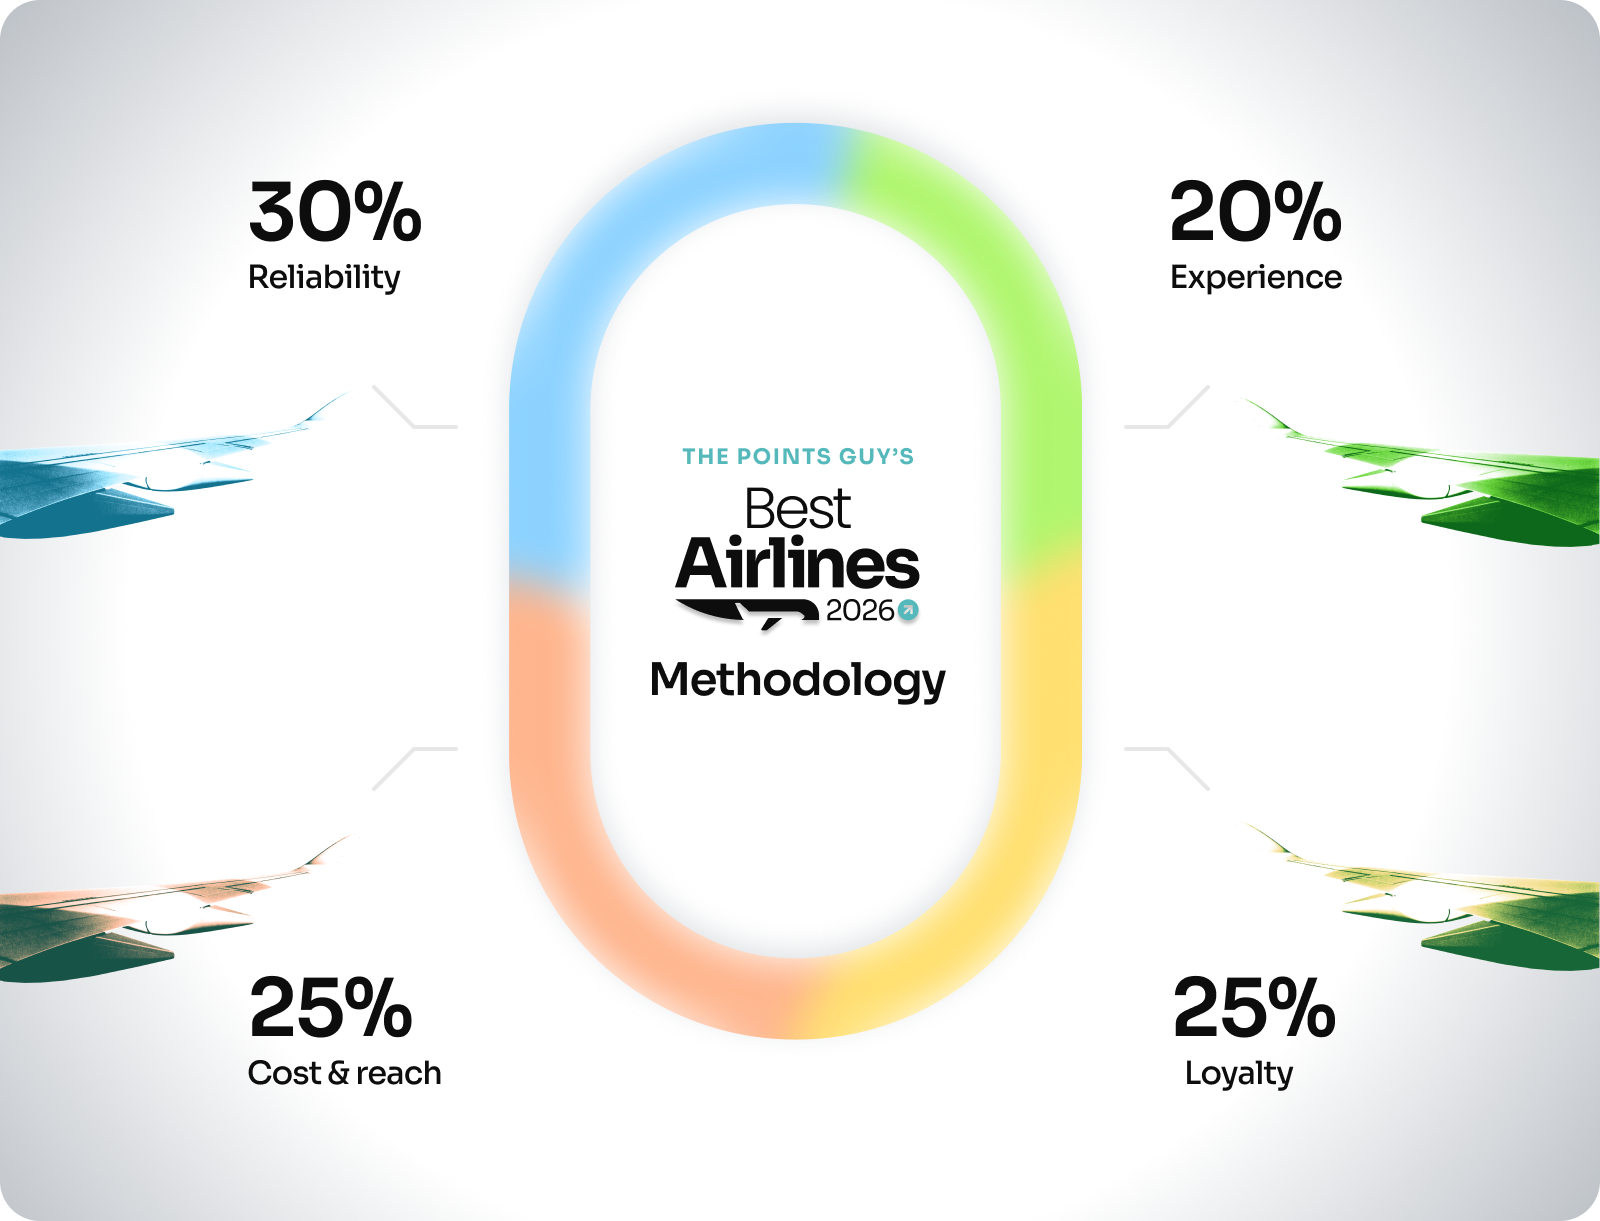
We give the strongest emphasis (30%) to the Reliability portion of the report, which deals with core performance factors like flight cancellations, delays and mishandled baggage.
We also gave added weight in 2026 to the Cost and Reach section (25%), at a time when affordability and the availability of nonstop flight offerings is top of mind for consumers.
Key factors considered
Each of the report's four categories look at a myriad of key industry metrics analyzed by our editorial team.
Here's what we looked at in each section:
Reliability (30% of overall score)
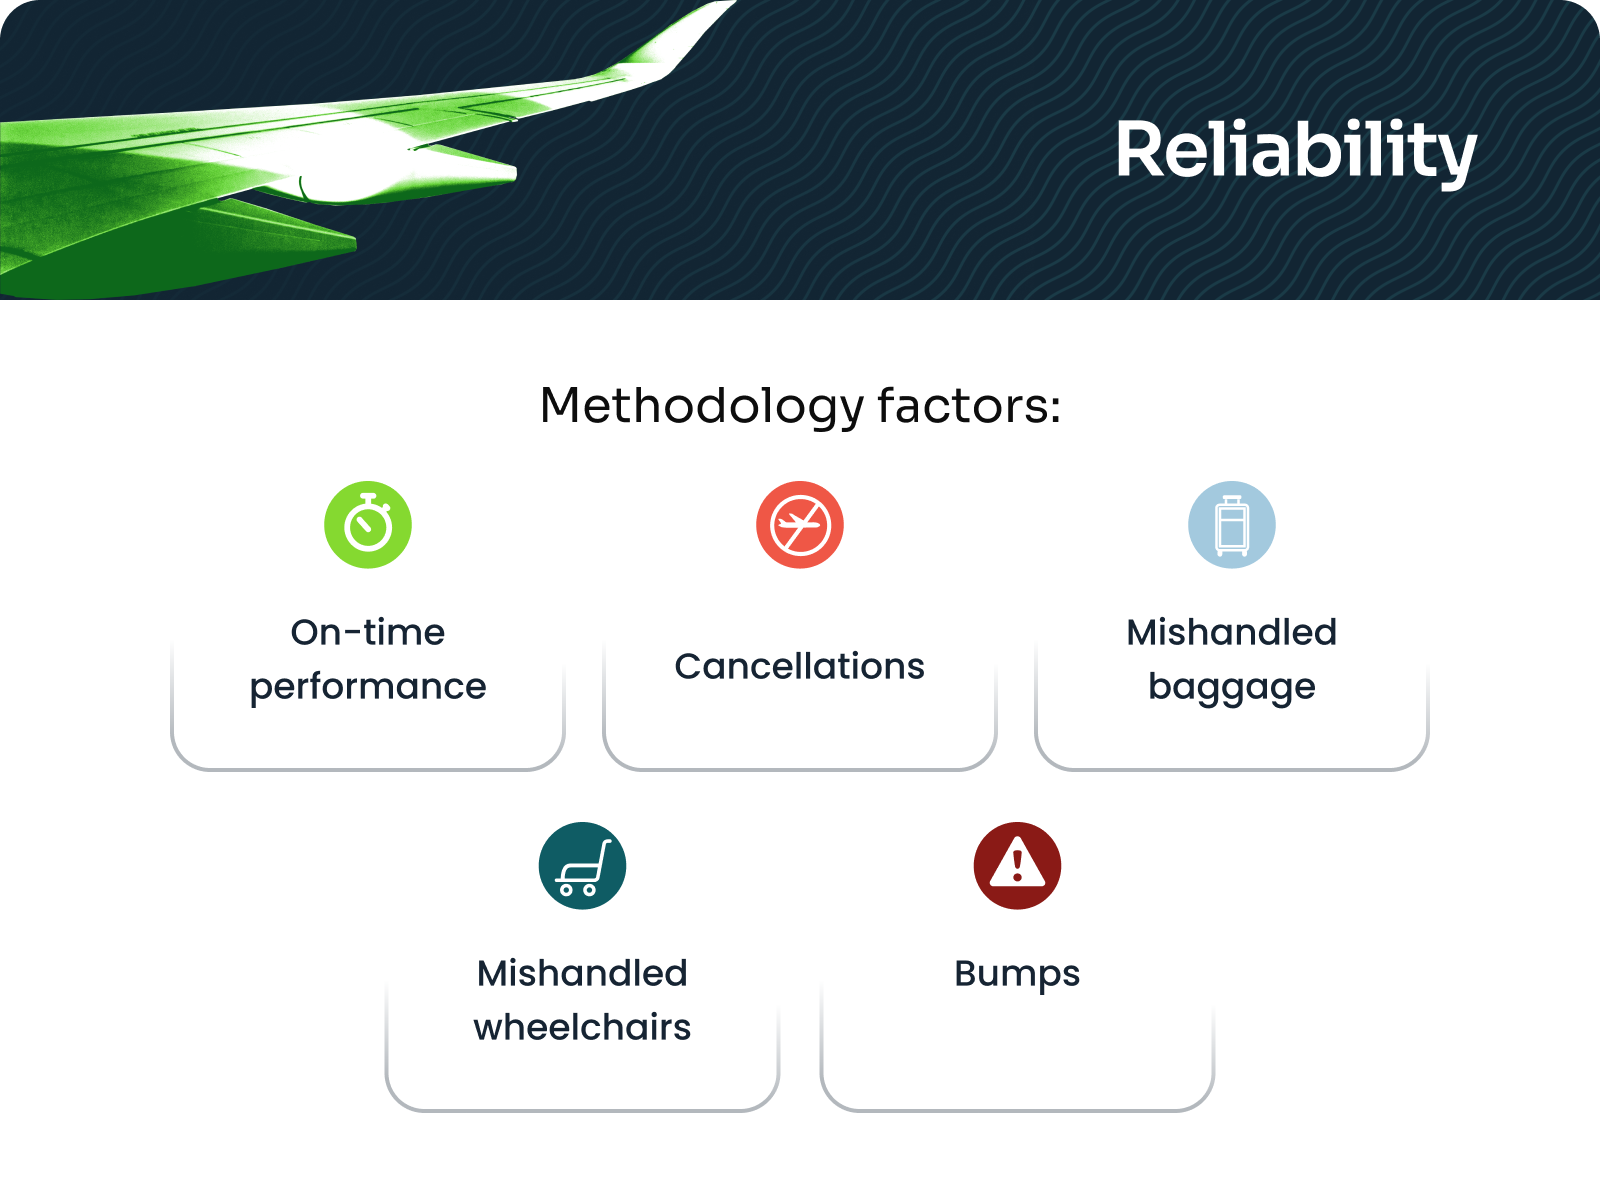
- Timeliness: How frequently a flight on the airline was delayed.
- Cancellations: How frequently a flight on the airline was canceled.
- Bumps/involuntary denied boardings: How frequently an airline bumped a traveler against their will on an oversold flight.
- Baggage: How frequently an airline mishandled a piece of checked luggage.
- Wheelchairs/scooters: How frequently an airline mishandled a mobility device.
All data as reported by the U.S. Department of Transportation.
Experience (20% of overall score)
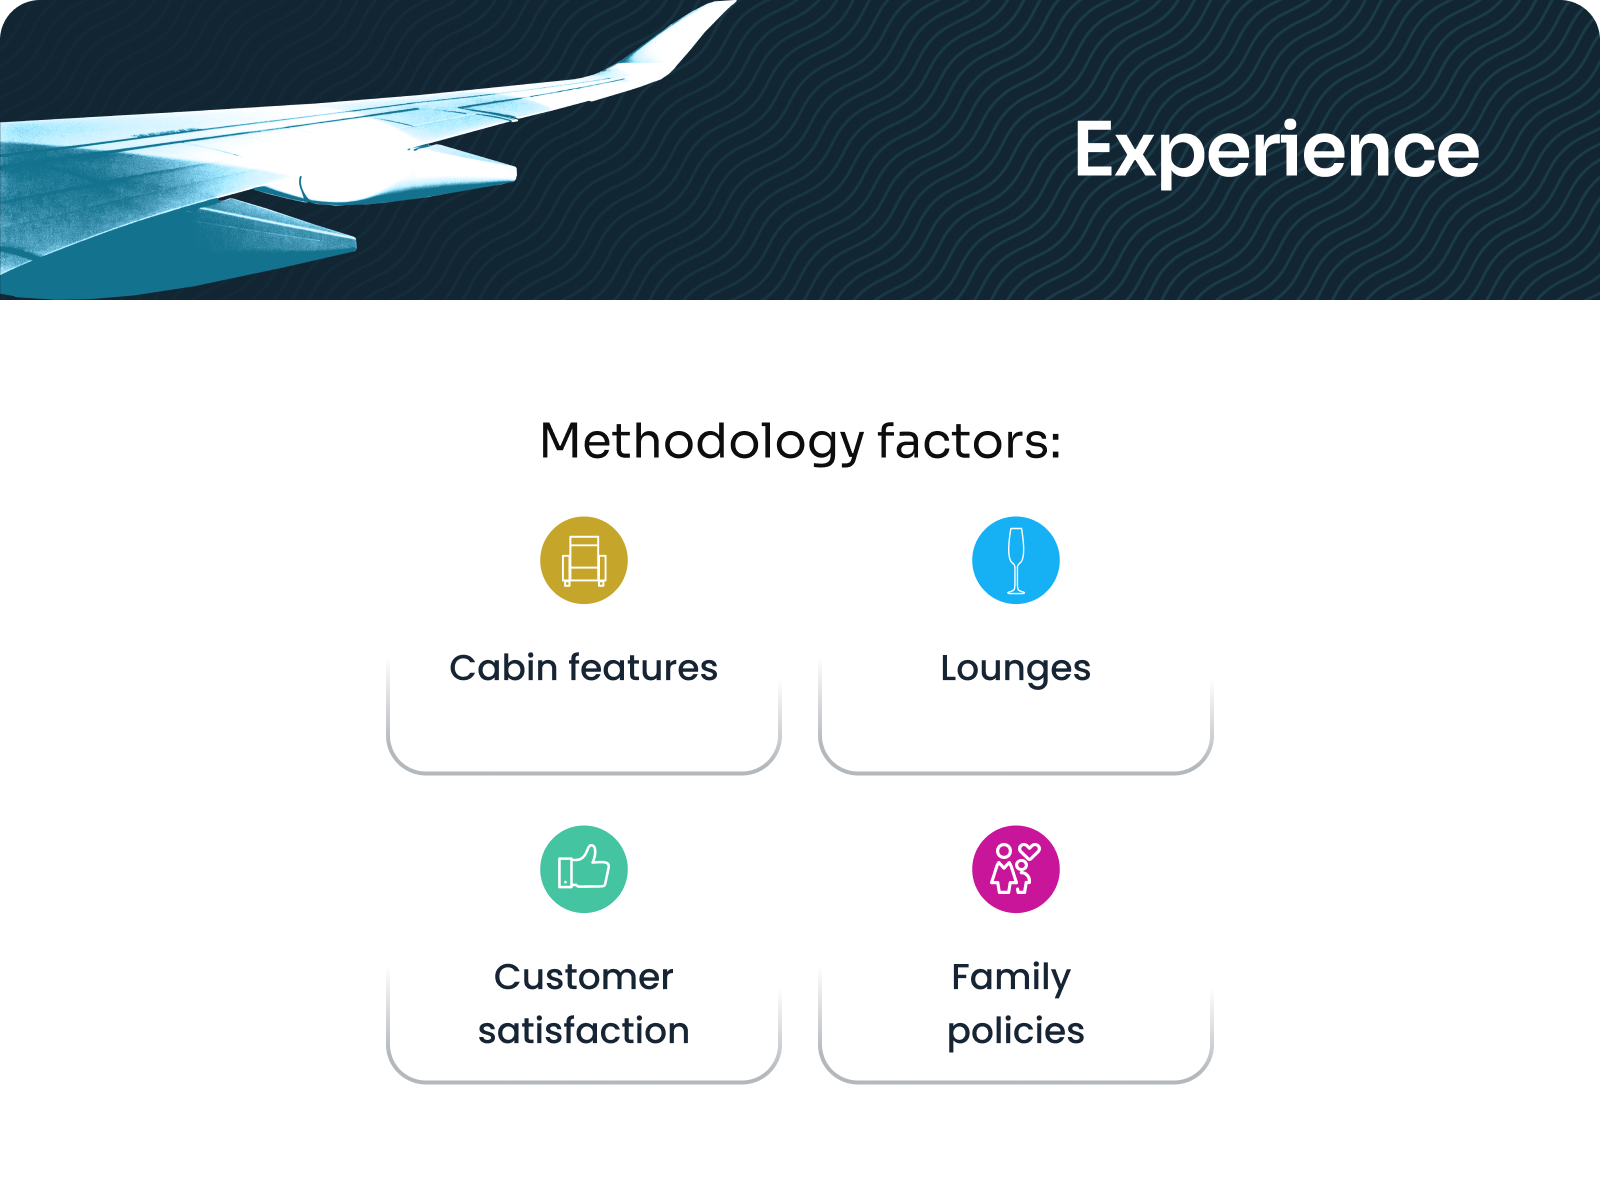
- Cabin features: What you'll experience on board, including Wi-Fi, seat pitch/width and inflight entertainment
- Family: How well an airline caters to families traveling with children.
- Customer satisfaction: The rate at which passengers complain to the DOT about the carrier.
- Lounges: Our new formula in 2026 analyzes which airline lounge network offers the best bang for travelers' buck, accounting for entry rules, guest policies, credit card access (and annual fees), along with a carrier's lounge footprint.
Cost & Reach (25% of overall score)
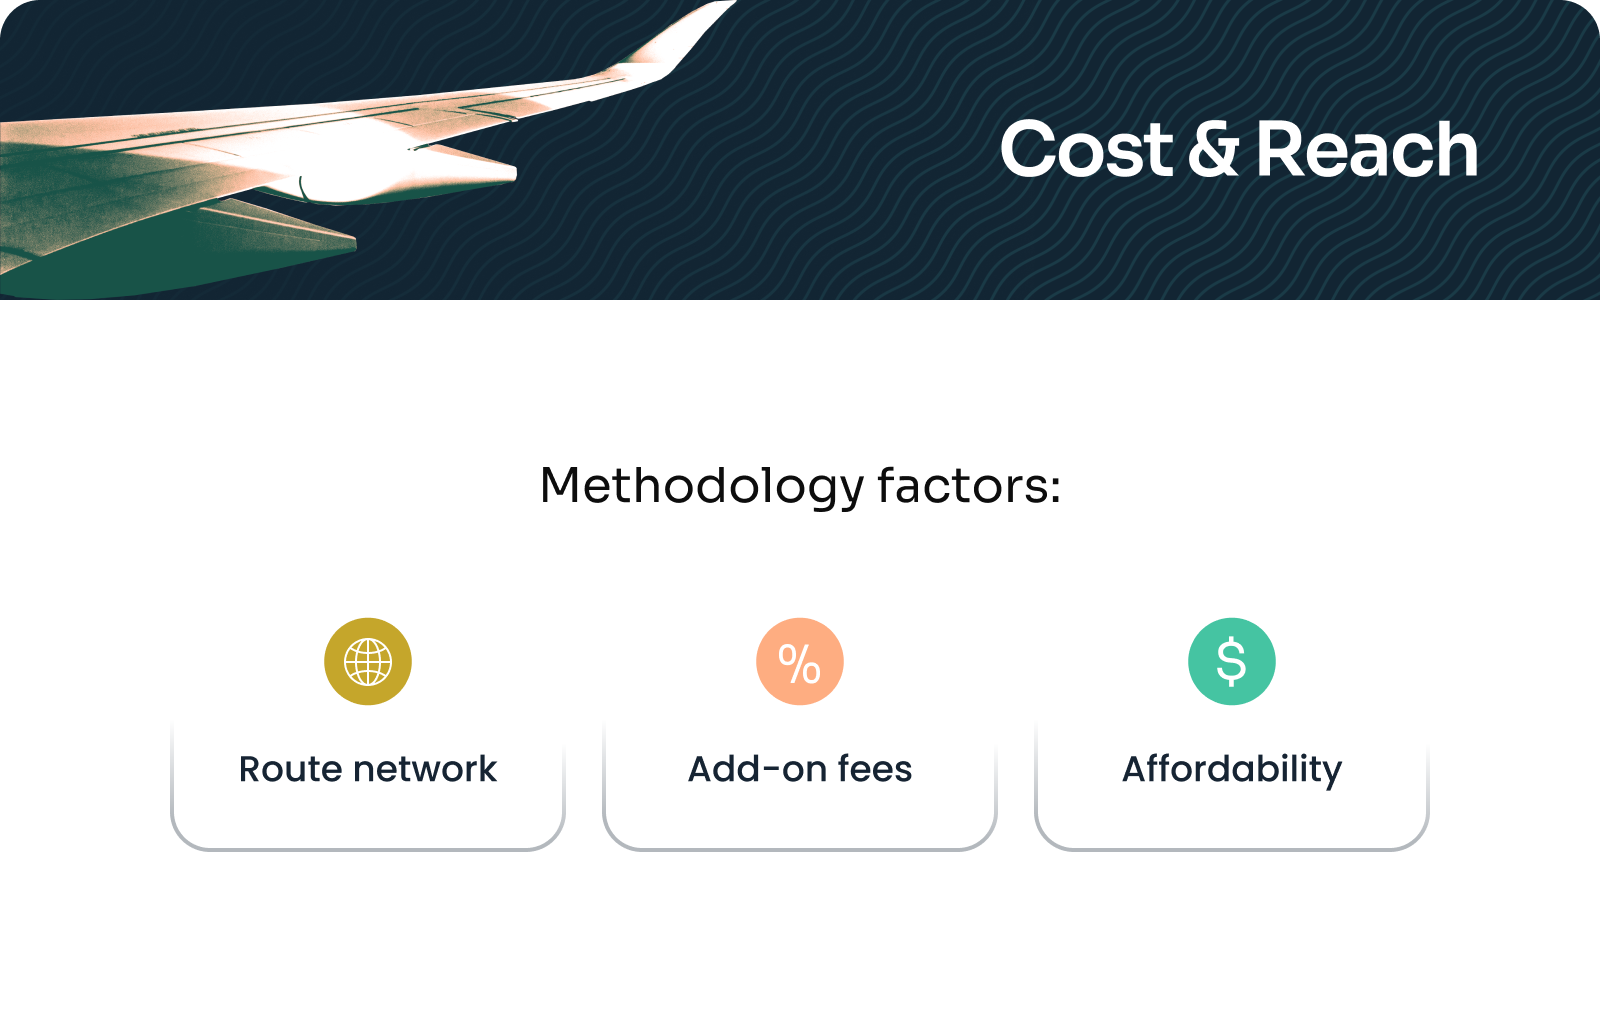
- Route network: How many domestic airports an airline served, on average, weighted 80% domestic and 20% international. We also took into account an airline's Available Seat Miles, or ASMs, a key industry indicator of an airline's network breadth).
- Affordability: How far (in distance) you can fly for the money you're paying, based on financial data from the Bureau of Transportation Statistics.
- Ancillary fees: How much a typical passenger pays in bag and change/cancellation fees.
Loyalty (25% of overall score)

How rewarding an airline's loyalty program and award currency are based on TPG's valuations, elite status, cobranded credit cards, partner airlines and mileage expiration policies.