The Best and Worst US Airlines in 2018


You may have noticed that 2017 wasn't exactly a banner year for the public image of US airlines.
For an industry that certainly wasn't beloved by Americans even before the events of the last 12 months, it almost seemed at times as if airlines were actively going out of their way to make themselves the most despised companies in America in 2017. But is it fair to assume that a handful of negative headlines represent a carrier's entire operation? Millions of customers fly on US airlines every month, and the quality of each of those trips can't be boiled down to a half-dozen passenger incidents amplified through news reports and social media.
A honest and true look at airline performance can only come from analyzing objective data, and that's why The Points Guy has undertaken our second-annual comprehensive study of the largest airlines in the United States. From prices to cabin comfort to frequent flyer programs, we've dug through the numbers across 10 criteria covering every aspect of each airline's operations, and ranked the best, the worst and everyone in between. And as always, if you don't agree with how we've weighted our various criteria, you'll have a chance to weigh in yourself as well.
Candidates and Criteria
As we did in our report on "The Best and Worst Airlines in 2017," our study encompasses the largest US airlines as measured by the number of domestic passengers, and excludes regional carriers that partner with one or more airlines. However, there are two exceptions to our list this year.
First, as was the case last time around, we were unable to include Allegiant Air since it was not possible to obtain enough data to accurately rank the airline. However, Allegiant has grown large enough that it was directed to begin reporting additional data to the Department of Transportation and other federal agencies starting in January, so we expect to include Allegiant in our list of airlines next year.
The other rub in this year's ointment is the acquisition of Virgin America by Alaska Airlines. While we were able to retrieve essentially all data for Virgin for the last 12 months, the fact is that the combined airline is already flying under a single operating certificate, and starting in April, the airline will no longer sell tickets for Virgin flights. Therefore, rather than rank a soon-to-vanish airline, we calculated separate scores in each criteria for Alaska and Virgin, and then weighted them together to give the combined entity a single final rating.
As a result, for just this one year, our report's 10 airlines number only nine...
While we had a change in airlines this year, our 10 criteria are identical to last year, grouped into four categories that we think best reflect the passenger experience when flying in the US...
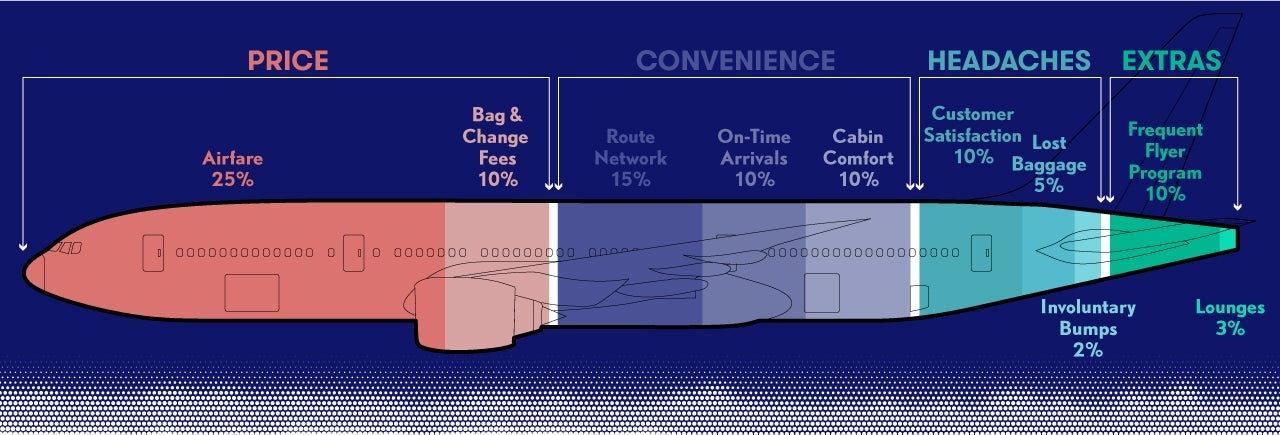
We've kept our weightings consistent from our previous study, as most passengers still book airline flights primarily based on Price — comprised of both airfare and baggage and change fees — and Convenience, which includes the size of an airline's route network, on-time performance and cabin comfort. A smaller subset of road warriors value Extras such as lounges and frequent flyer miles, and of course everyone hopes to avoid those dreaded Headaches like lost bags, bad customer service and getting bumped (though hopefully not dragged off the plane as well).

The one change we did make this year was to adjust our scoring system. While our scale for each criteria still runs from 1 to 10 with 10 being highest, this year we're using proportional scores instead of straight rankings. This awards greater credit to airlines that do an exceptional job in our criteria.
For instance, Southwest regularly leads all airlines when it comes to baggage and change fees because it generally doesn't charge for either. That puts it head and shoulders above the rest of the industry, but under our old scoring system, Southwest would score a 10 in this criteria and the second-place airline would get a 9, even though it charged a great deal more in fees. Under our new system, Southwest stands alone with a score of 10 for fees, and all the other airlines' scores are scaled proportionately from that point based on the raw data. We believe this new system provides a more accurate look at the real-life customer experience.
Overall Results
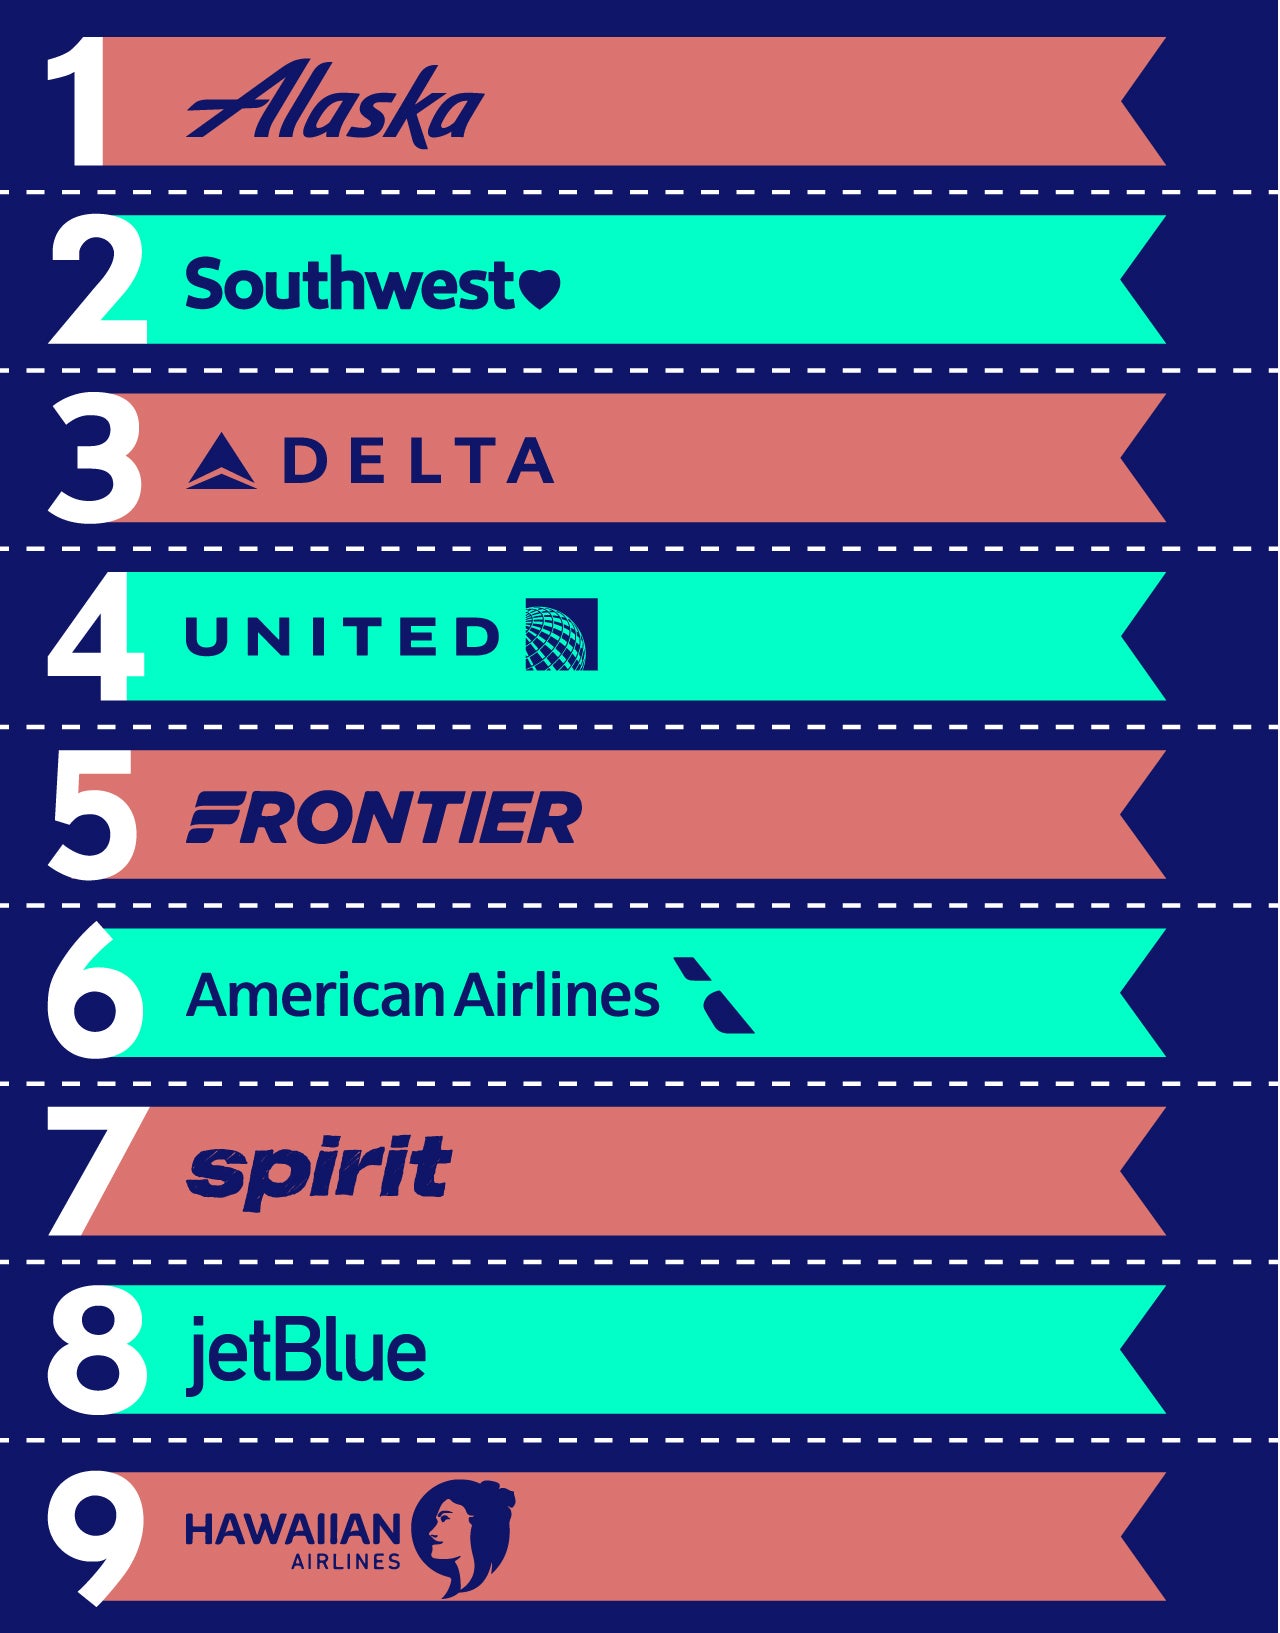
With all the data collected and the numbers crunched, here are TPG's Best and Worst Airlines for 2018:
There's quite a bit to unpack in these results, so let's take a look at each airline's performance one at a time...
1. Alaska Airlines
Last year's ranking: 1
For the second consecutive year, Alaska Airlines sits at the top of our list, and that won't be a surprise to many. The airline continues to be a favorite of its customers, and ranked in the top 3 across half of our criteria — airfare, on-time arrivals, baggage handling, customer satisfaction and its best-in-the-industry frequent flyer program. Alaska's ongoing merger with Virgin America has not negatively affected the airline's performance, at least to date, though the true test will come later this year when Virgin ceases to exist and the two are truly one combined airline.
2. Southwest
Last year's ranking: 6
Right behind Alaska is Southwest, another fan favorite but one that ranked a surprisingly low #6 in our last study. While our switch to proportional scoring did help Southwest a bit this year, the airline still would have ranked third using our old scoring system, so this result reflects a true improvement in performance. The carrier saw gains in two key areas — lower airfare and an increase in the size of its already substantial route network — while continuing to rate at the very top of customer satisfaction and baggage and change fees.
3. Delta
Last year's ranking: 7
Delta jumped from a very low finish in our last report all the way up to #3 this time around. Some readers argued last year that Delta was a better airline than our rating represented, and while our revised proportional scoring model did help Delta this year, the carrier would have moved up several spots even under our old scoring system. The reason is that Delta made slight improvements across several of our criteria, such as airfare and bumps, while still maintaining top 3 scores in others like on-time arrivals, lost baggage and the size of its network.
4. United
Last year's ranking: 2
Readers wondered if United's rocky year in the public eye would affect its rankings, but the airline dropped only two spots this year to land in fourth. The airline actually improved its performance in involuntary bumps as well as decreasing customer complaints by 17% year-over-year, but several other airlines improved in that category even more, and United fell behind in other areas such as airfare and lounges.
5. Frontier
Last year's ranking: 9
A more surprising upward move is Frontier going from second from last all the way to fifth place. More than any other airline, Frontier benefited from our new scoring — proportional scoring pulled the airline a number of points ahead of Spirit in several criteria, whereas before it was often second-to-last. To be fair, the carrier did make noticeable improvements in mishandled baggage while continuing to aggressively expand its route network, and maintained its position in nearly every other category.
6. American Airlines
Last year's ranking: 5
American Airlines didn't move much up or down, landing at #6 this year after coming in fifth in the last go-round. The carrier continues to put up mediocre numbers in on-time arrivals, lost baggage, fees and customer satisfaction, a criteria in which it ranked ahead of only low-cost carriers Frontier and Spirit.
7. Spirit
Last year's ranking: 10
The airline that was at the bottom of our previous study moved up a few notches this year to #7 — an improvement but hardly anything to get excited about. However, it should be noted that Spirit had a massive advance in the area of checked baggage, leading the entire industry in minimizing lost bags. But on the flip side of the coin, the carrier came in dead last in fees charged for those checked bags, keeping the airline mired in the bottom three of our rankings.
8. JetBlue
Last year's ranking: 4
Finally, the biggest drop in this year's study is JetBlue, which fell all the way from fourth to eighth. The airline ticked downward in several areas, including on-time arrivals — where it ranked dead last this year — baggage and change fees and customer satisfaction. But the larger issue with JetBlue is that it's being squeezed on both ends of the industry spectrum. It's not as big as the larger airlines, so it doesn't score particularly well when it comes to the size of its route network or having a robust frequent flyer program. But it also isn't a true low-cost carrier, so it has just average airfare ratings and isn't growing as fast as an airline like Frontier. Still, JetBlue gets high ratings in cabin comfort, undoubtedly due to its relatively impressive economy experience featuring excellent seat pitch and live in-flight TV, and its terrific Mint business class product.
9. Hawaiian Airlines
Last year's ranking: 8
Some people might think it odd to find Hawaiian Airlines in last place, but the airline didn't perform well last year either. The primary reason is that our study puts a lot of weight on both airfare and the size of an airline's route network, and Hawaiian doesn't do well in either of those areas. Hawaiian has some strengths, scoring relatively well in both on-time arrivals and avoiding involuntary bumps, and one could argue it's not fair to penalize the carrier for the fact that it's focused on a specific region. But even a theoretically "perfect" airline that was the most comfortable in the world with the greatest customer service and best on-time arrival rate wouldn't rank that highly to most people if it didn't fly to where the average customer needs to go.
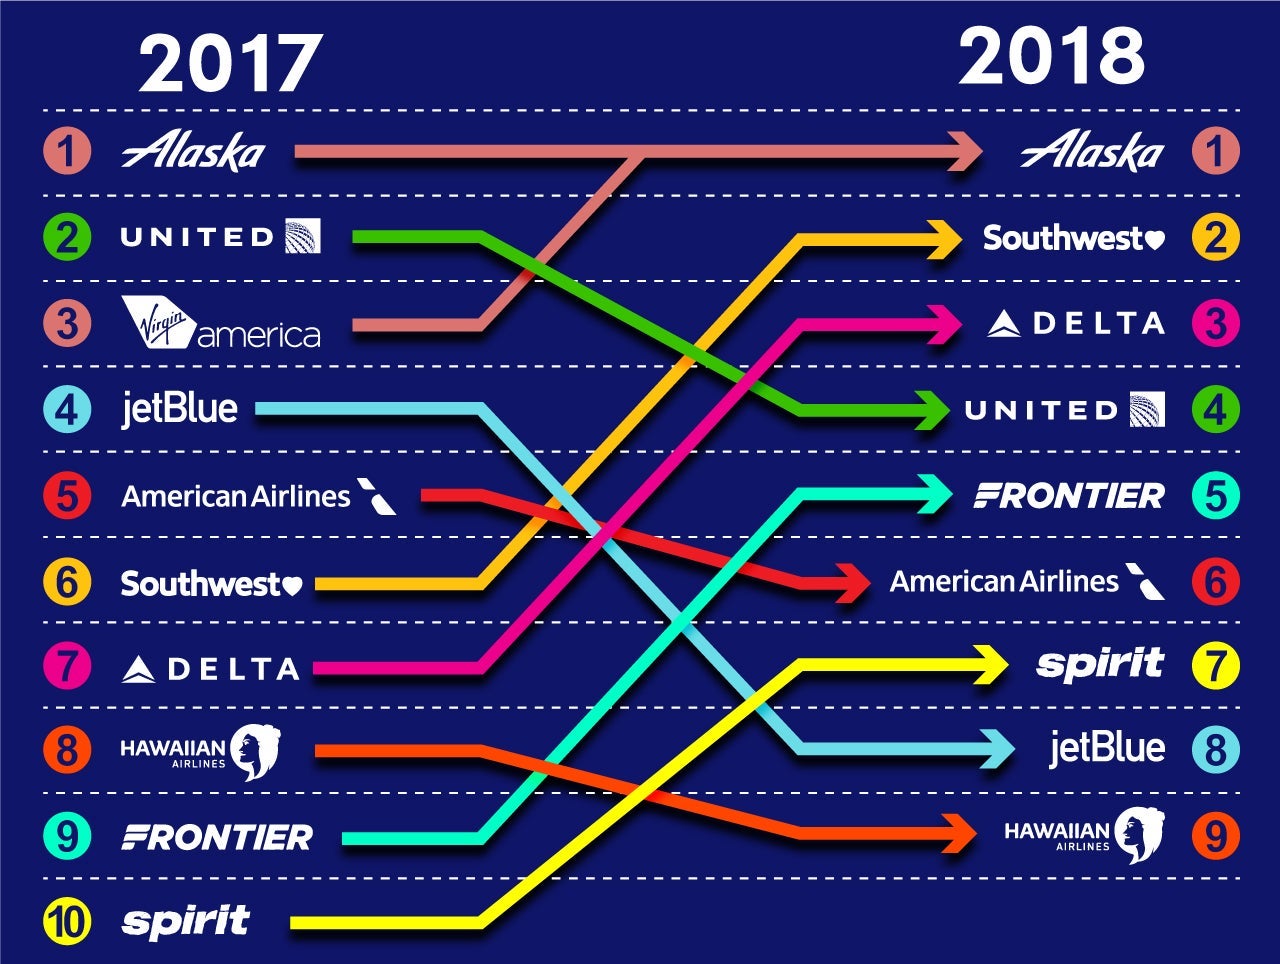
Moving Up, Moving Down
Several airlines in particular made significant moves from last year to this year, both upwards and downwards, and a number of our overall scores were extraordinarily close. Alaska is less than 1 point ahead of Southwest, while Delta and United are literally within a few tenths of each other, as are JetBlue and Spirit, and American and Frontier.
Methodology
As a leftover from deregulation in the 1970s, major US airlines are required to report a great deal of data about their operations and finances to the US government. That data is then made available to the public, though it's not always easy to sift through. But it makes it feasible to analyze many aspects of an airline using objective numbers instead of expert opinions or reader surveys.
For instance, all the airlines in our study are mandated to report monthly statistics to the Department of Transportation (DOT) on mishandled bags and passengers who are involuntarily denied boarding, otherwise known as "being bumped." Airlines also report their on-time arrival rates, but in recent years there have been questions as to whether airlines are "gaming" those statistics by blocking extra time into their schedules to make sure arrivals are on time even when departures are not. To avoid this problem, we rely instead on OAG's annual Punctuality League report, which combines delays and cancellations for over 57 million flights worldwide to arrive at an overall "on time" percentage for each airline.
Another set of numbers compiled monthly by the D.O.T. are passenger complaints filed against each airline, which we use as an objective measure of customer satisfaction. Not every passenger who has a problem is going to file a complaint, but the data covers all the airlines in our study equally and includes over a dozen topics, such as flight problems, refunds and boarding issues.
You may be surprised to learn that the baggage and change fees collected by major US airlines are required to be reported to the DOT's Bureau of Transportation Statistics (BTS), which can be accessed using an online database called TranStats. That same database also provides airline financial data, such as the amount of revenue collected from passenger tickets and the number of revenue passenger miles (RPM) for each airline. Those numbers can be combined into a metric called "yield," which is the amount (in cents) an airline collects in airfare for each mile it flies a single passenger. Or to look at it from a customer's perspective, it's what passengers pay on average for every mile they fly, so we use it to represent the cost of airfare for each airline in our study.
Counting the number of cities and airports with lounges is a fairly easy task, though this year we gave a small bonus to airlines with premium lounges such as United's Polaris Lounge in Chicago and American's new Flagship Lounges in five different cities. But while airlines will happily tell you how many cities and routes comprise their route network, those numbers include service provided by regional carriers, which are not technically part of the airline. So rather than rely on those numbers, we instead search for domestic cities and routes operated directly by each airline using the origin and destination (O&D) database of the BTS.
[pullquote]It isn't a simple matter to boil down things like food quality and Wi-Fi availability to a simple number. One person's ample legroom is another's painfully cramped seat.[/pullquote]
Cabin comfort can, by definition, be a somewhat subjective topic — one person's ample legroom is another's painfully cramped seat. It also isn't necessarily a simple matter to boil down things like food quality and Wi-Fi availability to a simple number. But a company called Routehappy assembles ratings on multiple cabin features for thousands of individual flights, which are then utilized by companies such as Google Flights to compare and contrast across various airlines and routes. So as we did last year, we took the top 25 routes by passenger traffic for each airline and used the Routehappy public database to search for and calculate an average cabin comfort rating for every one of them.
Finally, when it comes to frequent flyer programs and elite status, no one knows those topics better than The Points Guy. Our monthly valuations regularly provide values of the points and miles of all the airlines in our study, and thanks to our recent in-depth report on "The Best Airline Elite Status Programs in the US," we had access to even more robust data on each airline's elite program than we did last year.
A few technical notes: All data in this report is from calendar year 2017 unless otherwise noted, and was normalized for the number of passengers traveling on each airline. We also restricted our data set to domestic numbers only, except when separating the domestic data from the worldwide data was impossible.
It's Your Turn
We give a lot of thought in each report as to how to weigh our various criteria, but we know it's impossible for everyone to unanimously agree on what are the most and least important elements when it comes to an airline's operation. That's why we like to give our readers an opportunity to make those decisions for themselves by providing an interactive tool with all our research data pre-loaded, but the ability to tweak the criteria weightings in any manner desired.
Use the tool to set your own percentages across the categories, and you'll see the results recalculated in real-time based on your choices and our data. For instance, if you don't care about baggage and change fees, you can weigh it less than the 10% we chose and emphasize something else with the extra percentage points. Or if frequent flyer programs are extremely important to you, push that criteria up as far as you'd like. The interactive tool will automatically increase or reduce the weight of other criteria to make everything add up to 100%, so it's up to you to pick and choose what you want prioritized and de-prioritized.
The Bottom Line
Here is a recap of the best and worst US Airlines of 2018:
- Alaska Airlines
- Southwest
- Delta
- United
- Frontier
- American Airlines
- Spirit
- JetBlue
- Hawaiian Airlines
Even with several significant changes in our rankings this year (and taking into account the change in scoring), there were not that many drastic ups and downs within our individual criteria. What this demonstrates is that, even with mass consolidation in the US airline industry over the last decade, real competition still exists in the sector, especially from the low-cost carriers. As a result, small details can really matter when nine airlines are competing against each other, and a minor change in one or two criteria — such as better on-time performance or a reduction in the number of lost bags — can ripple out to cause a sizable rise or fall in overall performance.
That means for the airlines toward the bottom of our study, all is not lost. They can take solace in the fact that just a few small adjustments in their operations could drastically alter their performance next year. And on the flip side, while Alaska Airlines should take great pride in the consistency of its top-ranked performance, it can't rest on its laurels. Instead, the airline should be looking over its shoulder, because there are some eager competitors charging right up behind it.
Graphics created by MCKIBILO. Interactive data visualization tool created by Peiying Feng / SGS Agency. Art directed by Isabelle Raphael. Frequent flyer and elite status valuations provided by Peter Rothbart and Nick Ewen.
Other comprehensive reports from The Points Guy:
TPG featured card

at American Express's secure site
Terms & restrictions apply. See rates & fees.
| 4X | Earn 4X Membership Rewards® points per dollar spent on purchases at restaurants worldwide, on up to $50,000 in purchases per calendar year, then 1X points for the rest of the year. |
| 4X | Earn 4X Membership Rewards® points per dollar spent at US supermarkets, on up to $25,000 in purchases per calendar year, then 1X points for the rest of the year. |
| 5X | New! Earn 5X Membership Rewards® points on prepaid hotel stays booked through AmexTravel.com or the Amex Travel App. |
| 3X | Earn 3X Membership Rewards® points on flights booked through AmexTravel.com, the Amex Travel App, or purchased directly from airlines. |
| 2X | Earn 2X Membership Rewards® points on prepaid car rentals booked through AmexTravel.com or the Amex Travel App and cruises booked and paid through AmexTravel.com. |
| 1X | Earn 1X Membership Rewards® point per dollar spent on all other eligible purchases. |
Pros
- Valuable dining and food-related credits
- Flexible rewards with airline and hotel transfer partners
- Multiple travel and purchase protections
- No foreign transaction fees
- Access to Amex Offers for additional savings (enrollment required)
Cons
- Not as useful for those living outside the U.S.
- Some may have trouble using Uber and other dining credits
- You may be eligible for as high as 100,000 Membership Rewards® Points after you spend $8,000 in eligible purchases on your new Card in your first 6 months of Card Membership. Welcome offers vary and you may not be eligible for an offer. Apply to know if you’re approved and find out your exact welcome offer amount – all with no credit score impact. If you’re approved and choose to accept the Card, your score may be impacted.
- Earn 4X Membership Rewards® points per dollar spent on purchases at restaurants worldwide, on up to $50,000 in purchases per calendar year, then 1X points for the rest of the year.
- Earn 4X Membership Rewards® points per dollar spent at US supermarkets, on up to $25,000 in purchases per calendar year, then 1X points for the rest of the year.
- New! Earn 5X Membership Rewards® points on prepaid hotel stays booked through AmexTravel.com or the Amex Travel App.
- Earn 3X Membership Rewards® points on flights booked through AmexTravel.com, the Amex Travel App, or purchased directly from airlines.
- Earn 2X Membership Rewards® points on prepaid car rentals booked through AmexTravel.com or the Amex Travel App and cruises booked and paid through AmexTravel.com.
- Earn 1X Membership Rewards® point per dollar spent on all other eligible purchases.
- Pay It® lets you tap in the American Express® App to quickly pay for small purchase amounts throughout the month and still earn rewards the way you usually do. Plan It® gives you the option to split up big purchases into equal monthly payments with a fixed fee. You’ll know upfront exactly how much you’ll pay.
- Updated! $120 Dining Credit: Earn up to a total of $10 in statement credits monthly when you pay with the Gold Card at Grubhub (including Seamless), Buffalo Wild Wings, Five Guys, The Cheesecake Factory, and Wonder. This can be an annual savings of up to $120. Enrollment required.
- $100 Resy Credit: Get up to $100 in statement credits each calendar year at over 10,000 qualifying U.S. Resy restaurants after you pay for eligible purchases with the American Express® Gold Card. That’s up to $50 in statement credits semi-annually. Enrollment required.
- $84 Dunkin' Credit: Earn up to $7 in monthly statement credits after you pay with the American Express® Gold Card at U.S. Dunkin’ locations. Enrollment required.
- $120 Uber Cash on Gold: Enjoy up to $120 in Uber Cash annually with your Gold Card. Just add your Card to your Uber account and you'll get $10 in Uber Cash each month to use on orders and rides in the U.S. when you select an Amex Card for your transaction.
- New! As an American Express® Gold Card Member, you can enjoy complimentary Hertz Five Star® Status. Enjoy benefits like skipping the counter at select locations, adding an additional driver at no additional cost*, and vehicle upgrades**. Benefit enrollment and Hertz Gold+ registration are required. *Additional drivers must meet standard rental qualifications and must be a spouse or domestic partner to qualify as complimentary. Other additional drivers subject to fees. **Benefits are subject to availability and vary by location. Additional Hertz program Terms and Conditions including age restrictions apply.
- Take advantage of a $100 credit towards eligible charges* at over 1,300 upscale hotels worldwide when you book The Hotel Collection through AmexTravel.com or the Amex Travel App **. *Eligible charges vary by property. **The Hotel Collection requires a two-night minimum stay.
- Book your travel through the Amex Travel App with added peace of mind – backed by American Express® service and support. Only for American Express® Card Members.
- Whenever you need us, we're here. Our Member Services team will ensure you are taken care of. From lost Card replacement to statement questions, we are available to help 24/7.
- No Foreign Transaction Fees.
- Annual Fee is $325.
- Terms Apply.